

Why Your LinkedIn Benchmarks Need an Audit: The Case for Median Metrics
Article Summary
The Problem: Relying on average Engagement Rates (ER%) and Click-Through Rates (CTR%) creates skewed internal benchmarks because extreme outliers—like a single viral post or a complete flop—distort the reality of day-to-day performance.
The Solution: To fix this analytics blind spot, MedTech marketing teams must transition from using Averages to calculating Median Metrics to establish an honest performance baseline.
The MedTech Reality: Medical device product content varies wildly in format—where clinical trial data or surgical video carousels naturally crush the numbers of evergreen event reminders—making variance handling vital for realistic reporting to Product Managers.
Takeaway: This step-by-step guide provides social media and paid media managers with a 3-step framework to audit their raw LinkedIn metrics, remove outliers, and build consistent quarterly benchmarks.
Beyond the Baseline: Why Standard Analytics Are Failing MedTech Teams
Posting on LinkedIn has become the default channel for medical device and MedTech marketers—and for good reason. It is a powerful tool for reaching your target audience. However, LinkedIn posts vary wildly in performance. Some see high Engagement Rates (ER%) and Click-Through Rates (CTR%), others flop, and many fall somewhere in the middle.
This volatility makes it difficult to judge true performance. Once you’ve seen a post go viral, it’s hard to accept low-engagement content as "good." Yet, during monthly or quarterly reviews, Social Media or Paid Media Managers often rely on Average ER and CTR benchmarks when reporting performance to Product Managers. But is this the right approach?
Having analyzed marketing data for over 10 years, I have seen firsthand how social media platforms and their algorithms have evolved—and our approach to data must evolve with them. But not everyone has caught up – most still rely on Averages to guide their strategy. A recent performance review for a med-device client served as a perfect case study for why I advocate for the Median over the Average.
In this post, I will show you that Average isn’t always the best choice and how a different metric—the Median—can help you better optimize your social media strategy. (While I focus on LinkedIn for this post, the “Average” vs “Median” logic applies to any high-variance channel, like X or Instagram.)
Let’s dive in.
What is a benchmark and what is its purpose?
A benchmark is a reference point used to evaluate performance by comparing data against a baseline. Simply put, it helps you assess if your social post did “good” or “bad.”
For example, if your LinkedIn post shows a 5% ER and a 2% CTR, how do you evaluate that? You can't know without a reference point. If your benchmark for ER is 4.5%, your post performed well; however, if your benchmark is 10%, that same post significantly underperformed.
How to set an internal benchmark for your social media posts in 3 steps
STEP #1: Select your date range
For new accounts: If your brand is new to social media, work with whatever data you have available to establish an initial baseline.
For established accounts: If you have a longer history, you can select any range you wish to evaluate. However, I recommend starting with the last six to twelve months of data to ensure your benchmark reflects your most recent performance
STEP #2: Find your baseline posts and your outliers
Remove your best performing posts (the ones that have the highest performance) and the worst performing posts (the one that flopped). Don’t include them into the calculations – they are the outliers.
Calculate your total Average ER and Median ER% (Repeat for CTR)
Total Average = Add all your ER percentages together and divide by the total number of posts.
Total Median: List your ER percentages from lowest to highest and pick the one right in the middle.
Good to Know: If using Excel, use AVERAGE and Median built-in formula.
STEP #3 Establish benchmarks
Group your posts by quarter
Find Median ER% and CTR% for each quarter.
Find Average ER% and CTR% for each quarter
Why set quarterly benchmarks?
Quarterly benchmarks allow you to optimize your content throughout the year. You can use standard quarters or a rolling three-month average to track these trends. After 12 months, establish your Year 1 Baseline using Average and Median ER. Use annual benchmark for long-term planning and budgeting, and to set your goals (and growth targets) for Year 2, and so on.
Need help auditing your social media data? Book a strategy session to turn your raw metrics into a high-performance roadmap.
Deep Dive: Average vs Median Metrics
What is the difference between Average and Median?
The main difference is how each metric handles outliers.
The Median prevents one “viral” post from making your average look impossibly high, or one "flop” post from making it look too low.
The Average includes them in a total (sum) which causes the final results to be influeced by those extremes.
In medical device marketing, post types vary significantly—and so does their performance. Educational content (such as 'how-to' guides, clinical takeaways, and short videos) typically drives much higher engagement thanyour evergreen content (like event reminders or links to external YouTube content). The same applies to formats: rich media, such as carousels and native video, often outperforms plain text.
The trap
In my work analyzing social media data for MedTech brands, I often see teams apply the exact same average benchmarks across all post types. When most of their content falls "in the red," they immediately assume the creative assets need work. In reality, the issue isn't the content—it's the incorrect benchmarking. Applying a broad average to diverse content formats sets an unrealistic standard from the start.
Case-in Point: How Outliers Skew the Average
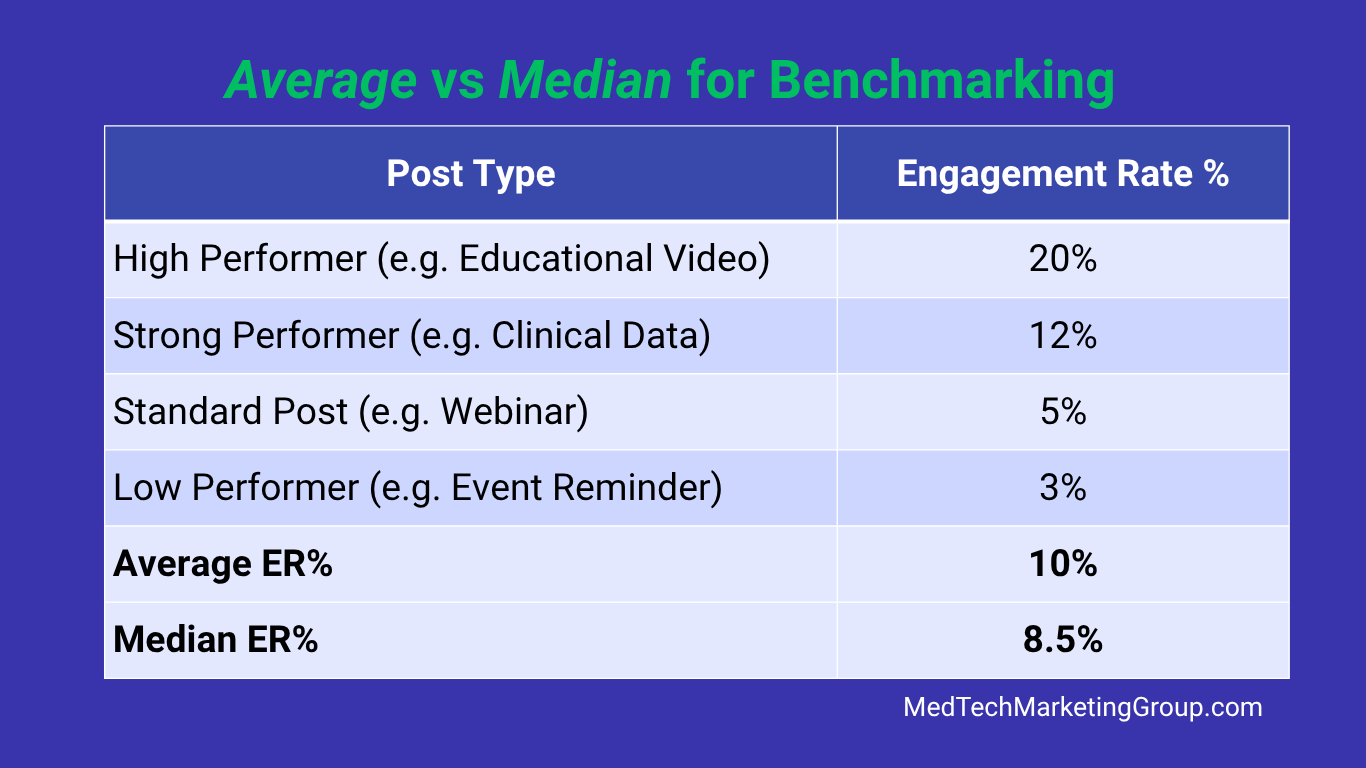
Disclaimer: The following data table is a simulated sample created for illustrative purposes. While it reflects performance trends observed in the medical device sector, specific metrics have been modified for confidentiality.
[+] Expand Data Table: Simulated Social Metrics (Average vs. Median Comparison)
| LinkedIn Post Type (Sample Cohort) | Engagement Rate (ER%) | Impact Analysis on Benchmarks |
|---|---|---|
| Post 1: Clinical Video Feature (Viral Outlier) | 22.0% | Drastically inflates the mathematical average. |
| Post 2: Product Launch Carousel | 9.5% | Sits right at the true middle performance tier. |
| Post 3: Expert Interview Text | 7.5% | Solid core engagement, close to the baseline. |
| Post 4: Webinar Evergreen Reminder (Flop Outlier) | 1.0% | Pulls the average down artificially. |
| Calculated Metric: Cohort Average | 10.0% | Skewed high; sets an unrealistic baseline for basic posts. |
| Calculated Metric: Cohort Median | 8.5% | Accurate; reflects the true baseline of typical content. |
The Problem with the Average
With a benchmark of 10%, you are forced to judge any post with a lower ER% as a failure. In this scenario, your 'top-performing' outliers mask your actual results, creating an illusion that your typical performance is much higher than it really is. Expecting every post to hit that 10% mark is an unrealistic expectation especially with evergreen content.
A Better Way: The Median
To get a more realistic baseline, use the Median. The median represents the "middle" of your data set, making it much less sensitive to those high-performing outliers. In this example Median ER% is 8.5%
How to calculate Median?
Use Excel Median Formula or a simple calculation based on the odd or even number of data points. 12%+5% =8.5%
Odd number of data points: The median is simply the middle value in your list.
Even number of data points: The median is the average of the two middle values.
Need help auditing your social media data? Book a strategy session to turn your raw metrics into a high-performance roadmap.
When to Use Average vs Median for Benchmarking
[+] Expand Data Table: Strategic Selection Matrix (Average vs. Median)
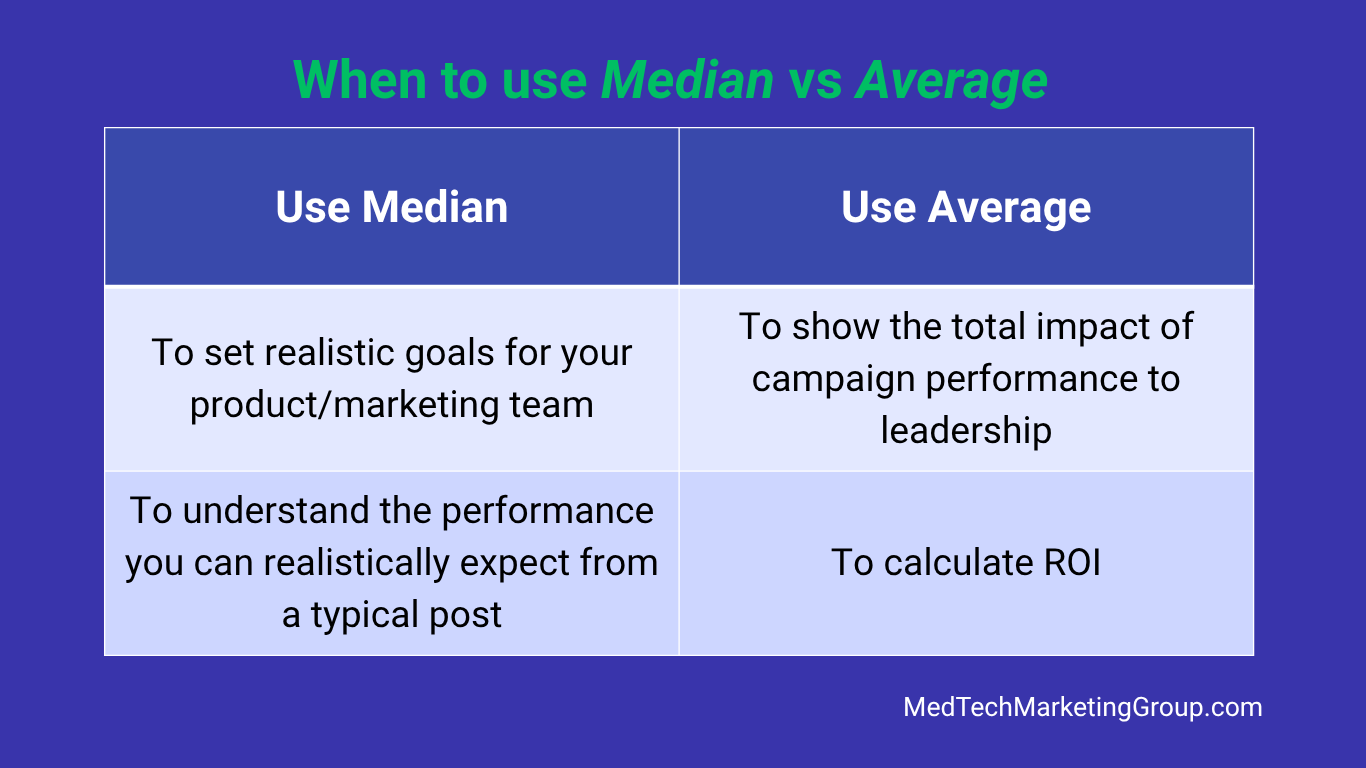
| Data Scenario or Content Type | Recommended Metric | Strategic Analytics Purpose |
|---|---|---|
| High Performance Variance (Mix of carousels, videos, and text links) | Median | Neutralizes extreme viral outliers to protect baseline goals. |
| Consistent Content Formats (Homogeneous campaigns with tight data spreads) | Average | Provides a true mathematical mean when variance is minimal. |
| Long-Term Financial Planning (Annual budgeting, ad spend scaling, macro forecasting) | Average | Captures the total absolute volume of results across the entire year. |
| Quarterly Performance Auditing (Content optimization, creative asset testing) | Median | Measures the literal "middle ground" of day-to-day audience interest. |
What the benchmarks are telling you?
If ER% is going up, your posts are doing great! If CTR varies, it is okay because your audience doesn’t always need to click through on every post (varies by content)
If ER% is going down, something isn’t right – you have to review for other factors - content type & quality, frequency & timing of posting, seasonality, etc.
If your Average is much higher than your Median, it means your “star” posts are carrying your page’s performance.
If they are close together, your strategy is highly consistent.
Final Takeaway:
When you rely solely on the Average, you let a single viral post set an impossible standard for the rest of your content. By switching to the Median, you gain a more honest view of your social media performance. This allows you to set achievable goals, keep your Product Managers' expectations realistic, and build a sustainable strategy.