

Do Banner Ads Actually Work?
Article Summary
The Problem: MedTech marketers frequently misjudge banner ad performance by relying on surface-level, pre-click metrics like Click-Through Rate (CTR%), causing them to cut budgets prematurely due to low immediate click attribution.
The Solution: Teams must shift their analytics framework to evaluate the complete multi-channel user journey, matching pre-click data with deep post-click engagement tracking and long-term trend analysis.
The MedTech Reality: Because medical device sales cycles are exceptionally long, a physician may see an awareness banner multiple times over several months before bypassing the click completely and executing a direct purchase through a sales rep.
The Takeaway: Evaluating banner efficiency requires looking past isolated metrics. Marketers must run placements for a minimum of 6 to 12 months with specific vendors to cross-reference quantitative actions against qualitative clinical interest.
Do banner ads work? Which banner ads are better? How much should I invest in banner ads?
You may have heard that banner ads are good for driving (product/disease) awareness. But do they actually work?
I have been analyzing MedTech marketing performance data for 10+ years. Moreover, I managed paid media - from buying banner ads from different vendors to handling creative direction and copywriting, to running experiments with creatives to see what drives results. I want to help you shift your perspective on banner ads. There is a right way and a wrong way to think about them, and the difference usually comes down to your data.
What are banner ads and what types of banners exist in advertising?
Banner ads, also known as display ads, are a form of a digital advertising usually in a rectangular or square graphic displayed on a third-party website to drive traffic to an advertiser’s website.
Core Banner Types:
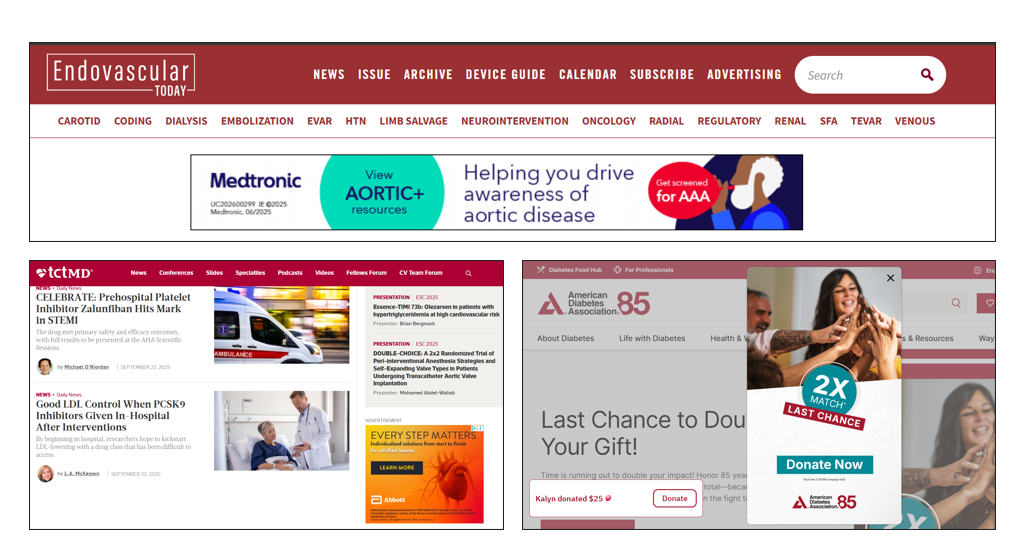
Leaderboard — usually appears at the top of the website and costs premium as it is positioned to catch user’s attention most effectively (top image)
Skyscraper — usually a tall and narrow vertical rectangle (thus the name) displayed on the left or on the right side of a webpage.
Pop-up banners — usually appear (or literally pop up on your screen as you open a webpage or pop-up open a new window) - yes, the annoying ones (right hand side image)
Responsive banners -- they respond or adjust automatically to the size of the device on which you are viewing the website
Mobile Banners — designed for a mobile display
Common banner formats
Static banners (usually in a form of a visual (jpeg format)
Animated (GIF or HTML files)
Video banners (usually contain a video in an mp4 format)
Interactive Banners -- provide additional engagement feature for the user, such as a quiz, puzzle, a game etc.
What’s the purpose of a banner ad? Why do you purchase banners?
Usually, the purpose of an ad is to drive awareness, engagement or conversions. In MedTech, banner ads are most commonly associated—not limited to-- with driving awareness of product launch, disease state or new clinical data. Banner ads can be used to drive engagement (thanks to the various interactive formats that are now available) or drive conversions (usually for a specific event, but rarely used). These do require a more creative approach to the ad and using interactive formats. For the purpose of this article, we will focus on using banners ads to drive awareness.
How do you measure effectiveness of a banner ad?
In marketing, one measures everything through KPIs, also known as Key Performance Indicators — metrics designed to evaluate ad performance. To measure ad’s effectiveness, you need to know the ad’s purpose.
In this example, we are looking at using banners to drive awareness (purpose: driving awareness).
Core metrics
How can you measure awareness of your ad? What metrics do you need to look at?
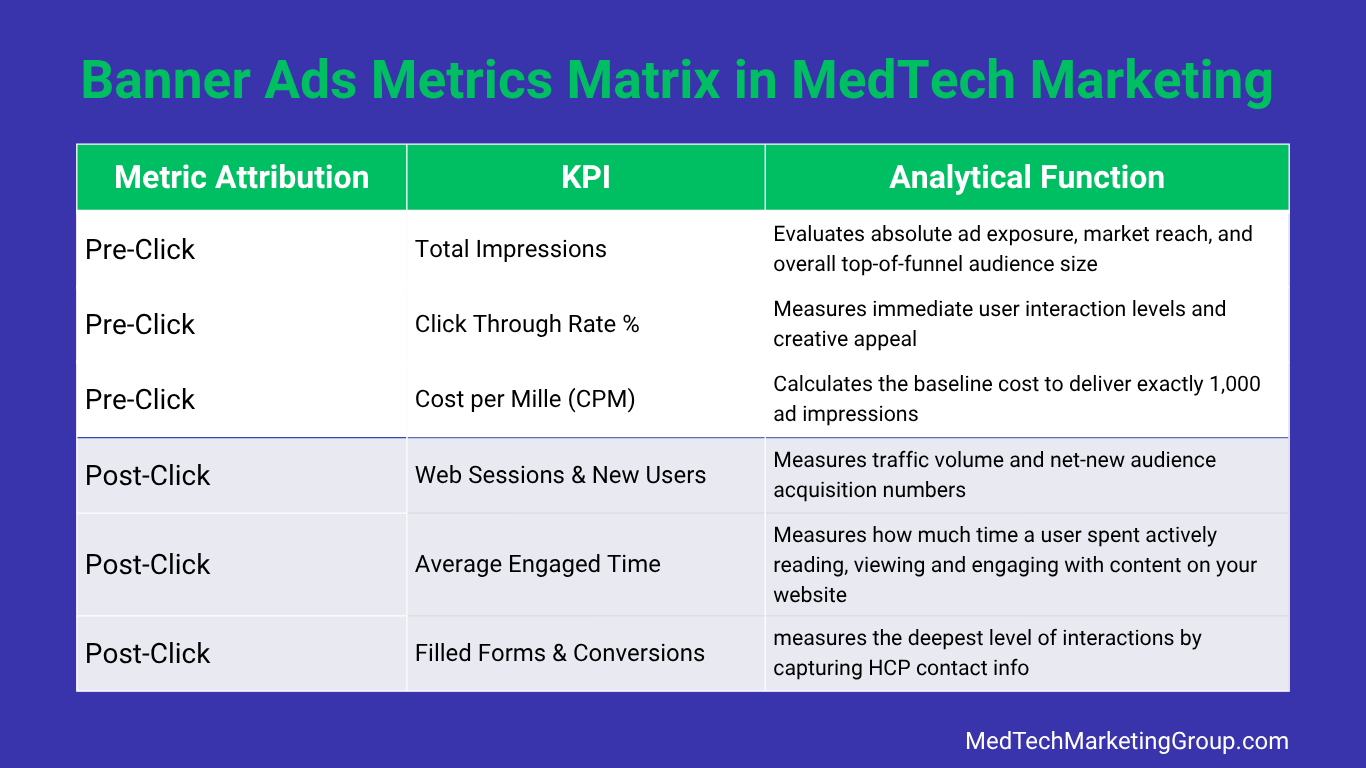
Pre-Click Data:
Impressions: impressions allow you to assess your ad’s exposure (reach), i.e. how often your ad is seen (or how many times the website has shown your ad to its users) but it doesn’t indicate if the audience interacted with your ad
Click-Through Rate (CTR %): this metric shows the interaction level, i.e. how many times users clicked on the ad (interactions means user has noted your ad and clicking on it to potentially learn more)
Cost Per Mille (CPM): how much does it cost you to purchase 1,000 impressions (from French “mille” meaning “one thousand”). CPM is derived by dividing the total cost by the total impressions
Post-Click Data:
Web Sessions & New Users: measures traffic volume and new-new user numbers
Averaged Engaged Time: measures how much time a user spent actively reading, viewing and engaging with content on your website
Filled Forms & Conversions: measures the deepest level of interactions by capturing HCP contact info
Keep in mind: While this example focuses on banners ads, if you are running an awareness campaign, there are additional metrics - set at the campaign level - to look for to measure awareness.
[+] Expand Data Table: Banner Ads Metrics Matrix in MedTech Marketing
| Metric | Key Performance Indicator (KPI) | Analytical Function in MedTech Campaigns |
|---|---|---|
| Pre-Click Data | Total Impressions | Evaluates absolute ad exposure, market reach, and overall top-of-funnel audience size. |
| Pre-Click Data | Click-Through Rate (CTR%) | Measures immediate user interaction levels and creative appeal. |
| Pre-Click Data | Cost Per Mille (CPM) | Calculates the baseline cost to deliver exactly 1,000 ad impressions. |
| Post-Click Data | Web Sessions & New Users | Measures traffic volume and net-new audience acquisition numbers. |
| Post-Click Data | Averaged Engaged Time | Measures how much time a user spent actively reading, viewing and engaging with content on your website |
| Post-Click Data | Document & Form Conversions | Serves as the ultimate bridge to revenue by capturing verified HCP contact data. |
What’s the difference between Awareness and Reach?
Awareness is frequently mixed up with reach, i.e. marketers look at the number of impressions a banner ad receives and assume that’s the awareness numbers. Impressions indicate the number of eyes the website has shown or displayed the ad too; it doesn’t mean the users actively seen and read the ad. A user can scroll past the ad on the website, but the website will count as a served impression. However, impressions do matter because they allow you to gauge the audience size the ad is reaching, although each impression is NOT unique, i.e. meaning it can be served to the same user multiple times.
If using just these three metrics, it seems it will be rather easy to make a conclusion if your banner ad is working or not—which is the biggest assumption most marketers make.
If your impressions are low, then only a small audience is seeing the ad, and the ad is not working.
If CTR is low, then no one is clicking on it, and the ad is not working.
If the CPM is too high, then ad is too expensive, and the ad is not working.
In reality, it is not so simple. This linear logic is often inaccurate, which is exactly why marketers struggle to determine if a banner ad is actually working or if they should stop sinking money into it.
Ensure you are properly tracking awareness and your dashboard is not missing these 3 key metrics.
Analyzing the data: how different scenarios impact your CTR
When using banner ads to drive awareness, the goal is to get as many eyes on the ad as possible, to expose it to as many people as possible—- to gain a place in their mind, or gain mindshare. Decade long research shows that a user needs to see your ad at least 7 times to retain its message. This means that ad duration matters; the longer the ad runs the more impressions it receives.
Stop obsessing over CTR% - Case in Point with 3 scenarios
Why is it so hard to justify banner ads investment in MedTech? Because when CTR % is low, it is easy to assume that no one is clicking on the ad, and if no one is clicking, the ad is not performing, therefore digital is not working.
But it is not always about the CTR.
What you don’t see is these three scenarios:
Scenario 1: The Unmapped offline clinical cycle
· A physician who saw the ad online, and then contacted the company’s Sales Rep for additional info
· A physician who saw the ad multiple times over a period of a few months, finally talked to a rep and ordered a product
Takeaway:
Just because a clinician scrolls past an ad without clicking doesn't mean the placement failed. Those unclicked visual touchpoints build baseline familiarity, ensuring that when your Rep stops by the clinic weeks later, the product name already feels recognizable.
However, because the MedTech sales cycle is exceptionally long— from weeks to months or even years—there is no clear, direct attribution linking that eventual product purchase back to the initial discovery ad.
When you need to show digital impact right now to protect your budget, but your immediate metrics are not in your favor, the banner ads get cut. And the cycle repeats.
Scenario 2: Deep post-click engagement metrics
What happens when a user does click on the ad? There are additional metrics, called post-click data, you can look at to understand deeper level engagement:
# of web sessions –how many times a user visited your website after the click
# of new users — how many new users your website acquired
Engagement Rate % — percentage of sessions where users actively engage with your webpage ad defined by GA4 analytics
Ave Engaged Time — how long did a user stay on your website actively engaged, as defined by GA4)
Organic search impressions volume — is the total volume (impressions) of branded search terms growing
Takeaway:
A high click-through rate means nothing if users leave your page immediately. Post-click engagement data helps you understand the exact depth of customer interest.
HCPs who engage more than average tend to show more interest in the product and be in the middle of the customer marketing funnel — where they are “actively shopping:” researching additional information, comparing to competitors, etc.
When you evaluate campaigns purely on total clicks without looking at post-click engagement, you end up renewing contracts with low-quality publishers. They fail to expand your reach or maximize your message exposure. You spend your budget on empty traffic, the campaign fails to generate actual sales leads, and the cycle repeats.
Scenario 3: High-level digital conversions as a bridge to revenue
How many conversions the ad received, i.e. high-level actions a user took on your website after clicking on your ad?
· Did they sign up for your newsletter?
· Did they fill out a format with their contact info?
· Did they download a brochure?
Takeaway:
Conversions are bridge to revenue in MedTech marketing. These high-value digital actions turn anonymous web traffic into a tangible, qualified sales pipeline for your field representatives. Once you capture a lead's contact info, you can sync them into Marketo or Salesforce for automated email nurturing. More importantly, it gives your Sales reps a qualified reason to follow up and close the deal.
If marketing teams stop tracking the journey at the initial click, they fail to connect digital promotions directly to pipeline value. When executive leadership looks at your reports and sees abstract digital metrics instead of direct pipeline impact, they see marketing as an expensive luxury. The budget gets slashed, and the cycle repeats.
Are you struggling to make sense of your metrics? Expert advice is a phone call away. Get in touch today.
Case study: comparing publisher performance data
Looking at the sample data for Publishers A and B, which one truly drove the best results?
Disclaimer: The following data table is a simulated sample created for illustrative purposes. While it reflects performance trends observed in the medical device sector, specific metrics have been modified to protect client confidentiality and proprietary trade secrets.
[+] Expand Data Table: Comparative Banner Ad Performance (Publisher A vs. Publisher B)
| Performance Metric Category | Publisher A Performance Profile | Publisher B Performance Profile | Strategic Optimization Verdict |
|---|---|---|---|
| Total Media Cost | Higher Initial Cost | Lower Initial Cost | Publisher B provides a more efficient entry point. |
| Total Served Impressions | High Gross Volume | Lower Gross Volume | Publisher A wins on absolute top-of-funnel reach. |
| Click-Through Rate (CTR%) | Higher Pre-Click Percentage | Lower Pre-Click Percentage | Publisher A looks superior if tracking ends at the click. |
| Cost Per Mille (CPM) | Lower Cost Per 1,000 | Higher Cost Per 1,000 | Publisher A appears more cost-effective on the surface. |
| Average Engaged Session Time | Lower Engagement Depth | Higher Engagement Depth | Publisher B Wins: Users stay longer to read clinical claims. |
| Engagement Rate (ER%) | Lower Interaction Percentage | Higher Interaction Percentage | Publisher B Wins: Drives higher-intent traffic quality. |
| Form/Brochure Conversions | 0 Verified Leads Captured | 1 Verified Lead Captured | Publisher B Wins: Successfully captures actionable pipeline data. |
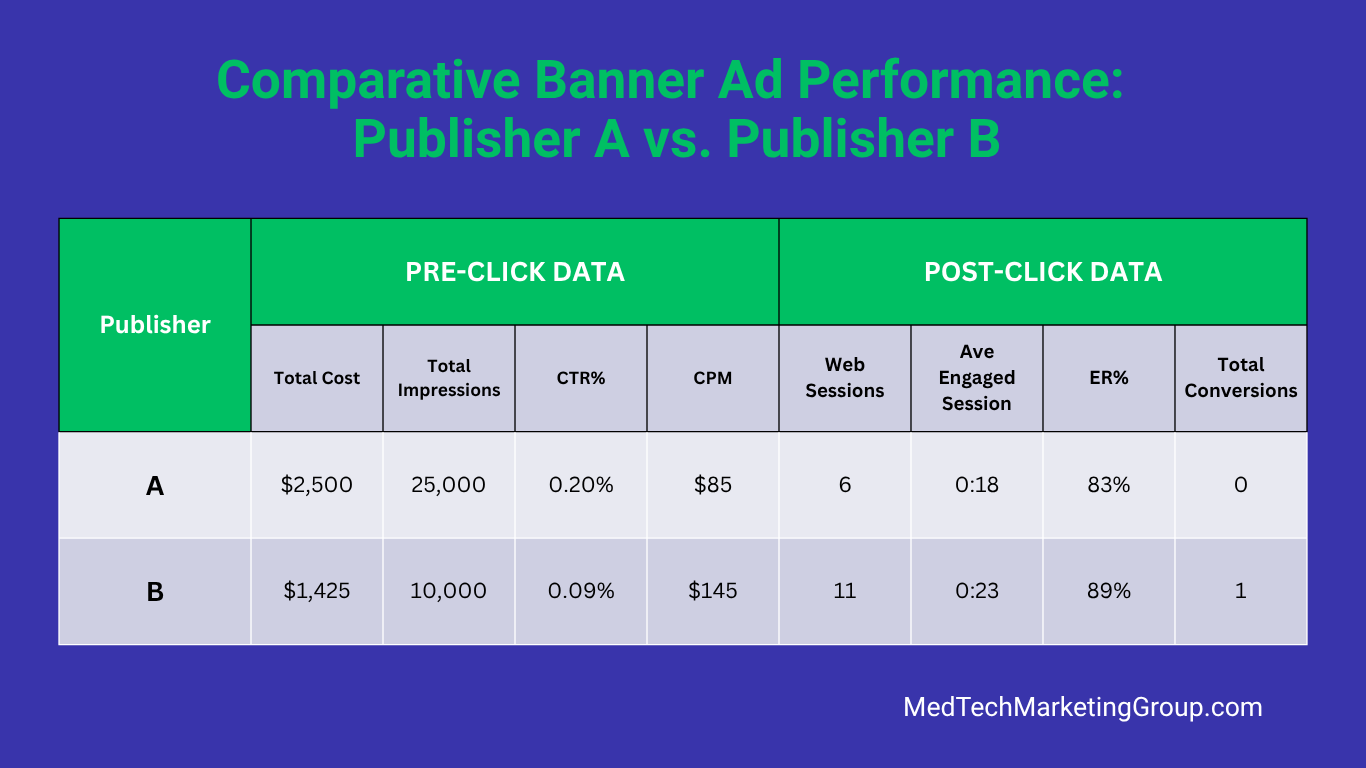
If you were to look only at the key KPIs for pre-click data --Total Impressions, CTR% and CPM -- you are more likely to conclude that Advertiser A is more effective: CTR is higher and CPM is lower than B; even though your total cost is higher, you are getting more impressions and clicks.
How will your decision change if: You were to look at the data on the right side of the table (known as post-click data): Engagement and Conversion?
Users that come from Advertiser B show more interest and are more engaged as seen in Higher Ave Engaged Session and Higher ER%. There’s a conversion, i.e. a user filled out a form with their contact info. [To fully examine the depth of this conversion, a Sales Rep needs to follow up with this contact to obtain more info].
How will your decision change if: this data reflects only one month performance? What if this data reflects 6 months performance?
Short-term data is unable to show a trend, it reflects performance for just one specific month or 2-3 months considering what’s going on in the environment: seasonality, political landscape, major congresses or new clinical data/research, etc. If your ad that runs in December (during the holidays) it may have a very different performance compared to February, but you can’t make a conclusion and make changes to your media plan based on this one month of data. Therefore, it is important to run banner ads for a minimum of 6 months to be able to understand the impact. Ideally, I’d recommend running banner ads for at least a year with a specific vendor to be able to gauge performance trend.
Final Takeaway
Marketing performance data tells a story. You cannot look at numbers in isolation and expect to see a clear, straightforward conclusion. To derive real value, you must look at the big picture—combining your quantitative metrics with qualitative insights across the performance of the entire multi-channel campaign, not a single ad.
So, do banner ad actually work? Look at your marketing data. Banner ads play an important part of your overall digital marketing strategy. By choosing different advertisers and reviewing long-term data, you can make a conclusion which advertisers work best for your product and which are not worth the spend.
Do you want to ask additional questions or need help with reviewing your banner ad performance data? We are a phone call away. Get in touch today.
