

How to Make Sense of Your Video Performance Data
As a Product, Digital Marketing, or MarCom Manager, you frequently partner with third-party advertisers or major congresses to produce and promote video content. However, once a campaign wraps, interpreting the performance data you receive isn’t always as straightforward as it seems. In this article, we’ll analyze a sample dataset and walk through how to turn those metrics into clear insights.
Article Summary:
The problem: How to choose the right metrics to evaluate video performance
Metrics that matter: Select metrics that match your primary objective
Case-in-Point: A step-by-step breakdown showing how the exact same video performance report can yield two completely opposite strategic conclusions based on which metrics you choose to prioritize.
Takeaway: When analyzing video performance, never look at numbers in isolation. A single metric can't tell the whole story. To uncover the story behind your data, you must look at the full picture and evaluate your metrics through the lens of your primary objective.
How do you compare medical device video performance against industry benchmark?
You receive this data from a third-party publisher on your video performance. When you look at these numbers, what is the initial conclusion you want to make?
Comparative Video Performance: Your Video vs Industry Benchmark
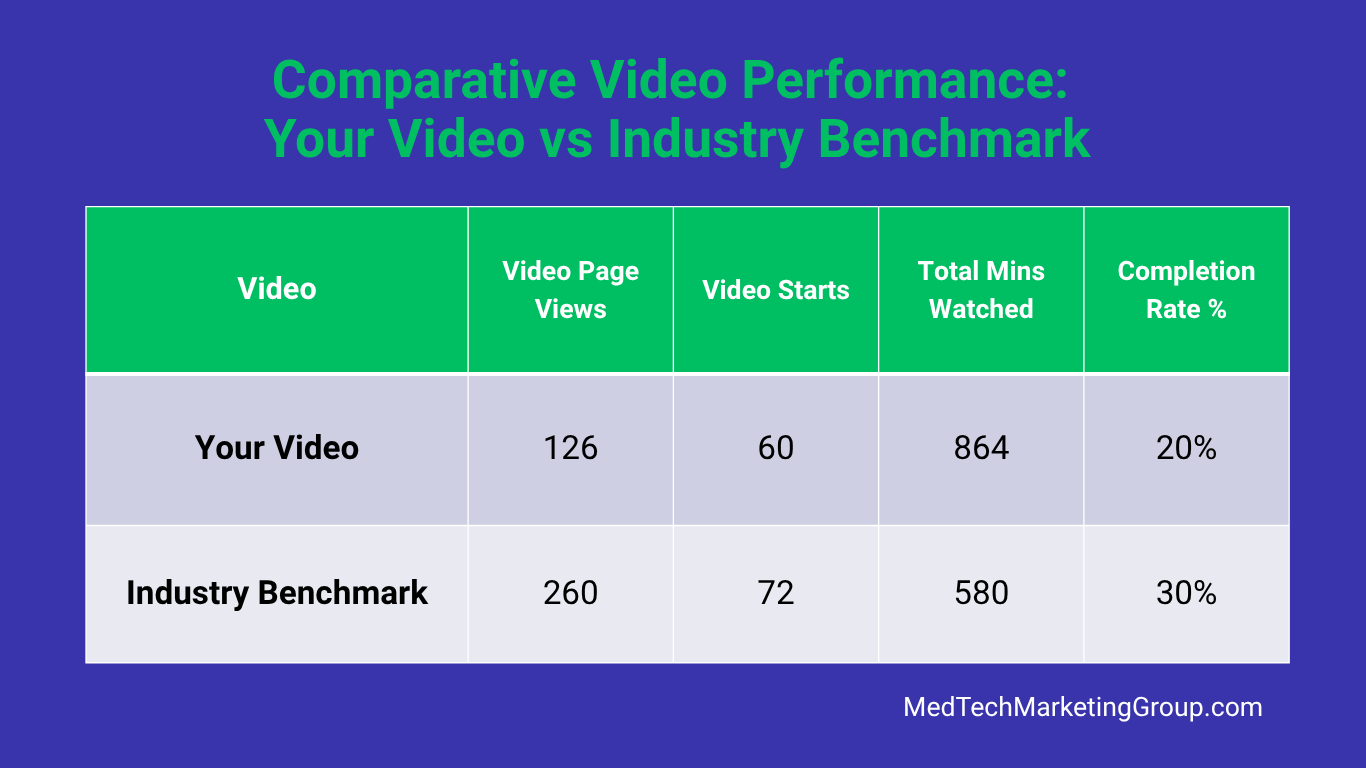
Table: Data sample representing a typical video performance report in medical device industry.
Disclaimer: The following data table is a simulated sample created for illustrative purposes. While it reflects performance trends observed in the medical device sector, specific metrics have been modified to protect client confidentiality and proprietary trade secrets.
📊 Click to expand text-accessible data table
| Video Page Views | Video Starts | Total Mins Watched | Completion Rate % | |:-------------------------------:|:------------:|:-------------------:|:-----------------:| | 126 | 60 | 864 | 20% | | 260 | 72 | 580 | 30 |
How to Understand Video Data and Metrics
Industry Benchmarks vs Your Video Data
At first glance, you might see industry benchmarks that appear much higher than your own, leading you to believe your video underperformed. But is that actually the case?
When reviewing video performance, it’s crucial to look at the full picture rather than isolated metrics.
First of all, why is industry benchmark data included? This data compares how your video performed in relation to a similar video from the industry, i.e. serves as a reference point. Simply put, to access if you video did “good” or “bad.” (Third-party advertisers compile this benchmark data as an average for the year or several years based on all the similar video content.)
Core Metrics Defined:
Video page views (or sometimes landing page views) refers to how many times users seen the webpage that hosts the video. In this example, users saw your video page only 126 times or 50% less than that of the industry benchmark.
Video impressions (sometimes video starts) refer to the number of times the video was clicked to play or auto-played. In this example, you video received slightly less views than the benchmark.
Total Minutes Watched refers to the total minutes the video was watched by all users, not necessarily from start to finish. In this example, users spent more minutes (or 49% more time) watching your video than a similar industry video.
Completion rate refers to % of users who watched a video from start to finish. In this example, only 20% of users watched your full video compared to 30% of industry.
Do you need help making sense of your marketing data? Expert guidance is a phone call away. Get in touch.
How to Interpret the Data: How to determine which metrics matter for performance?
To properly select the right metrics, align them to your primary objective. Let’s review how the video performance result varies based on the chosen objective.
Always start with your primary objective: what was the goal of the video promotion?
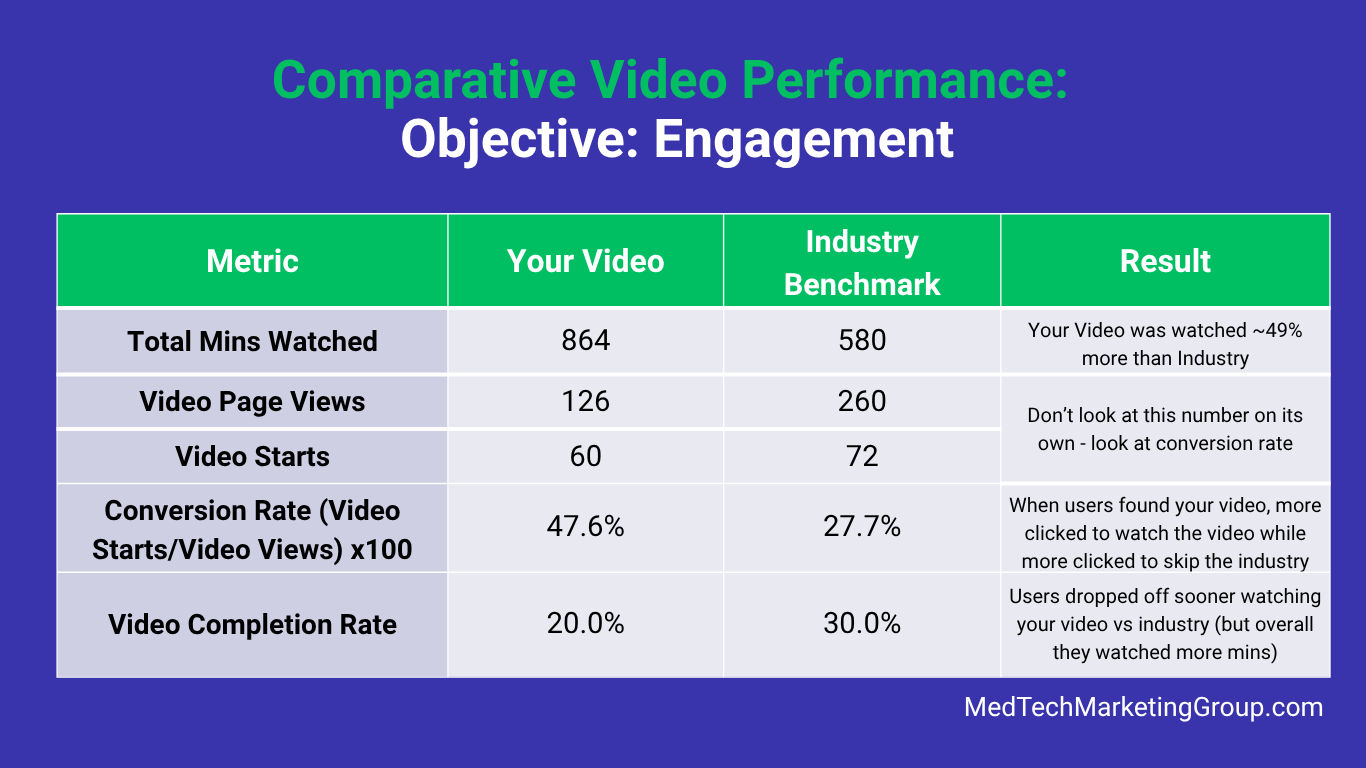
Scenario 1: Optimizing for Engagement
In our example, the goal was audience engagement. Since the goal is to get viewers to watch—and stay watching—the metrics that matter most are Total Minutes Watched, Conversion Rate and Completion Rate.
📊 Click to expand text-accessible data table
| Video Page Views | Video Starts | Total Mins Watched | Completion Rate % |
|---|---|---|---|
| 126 | 60 | 864 | 20% |
| 260 | 72 | 580 | 30 |
How did the video perform based on engagement?
Your video significantly outperformed the benchmark for engagement.
Engagement Performance Breakdown:
Total Minutes Watched: Your video achieved 49% more total watch time (864 vs 580 mins) than the industry average. (That’s great!)
Video Conversion Rate (Page View-to-Video Start): Your video achieved a 47.6% conversion rate, outperforming the industry benchmark of 27.7% by nearly 20 percentage points. While not always explicitly listed in standard dashboards, you can easily calculate this metric using the formula: (Video Starts/Video Views) × 100.
Why it matters: This metric is the best way to measure traffic quality. A higher rate proves that your video's thumbnail, title, or page placement was highly compelling, successfully convincing nearly twice as many users to click "play" compared to the industry average. That’s why it is important to not get distracted by the numbers alone (like higher industry view count) —your content is actually much better at capturing your audience’s interest.
Total Completion Rate: Users watching your video dropped off sooner (20% vs 30%) vs industry benchmark, but overall they watched your video longer time overall.
Result: The video crushed engagement goals by capturing 49% more total watch time and 20 percentage points higher click-to-play conversion rate than the industry average.
Additional Scenarios: Results Change based on Primary Objective
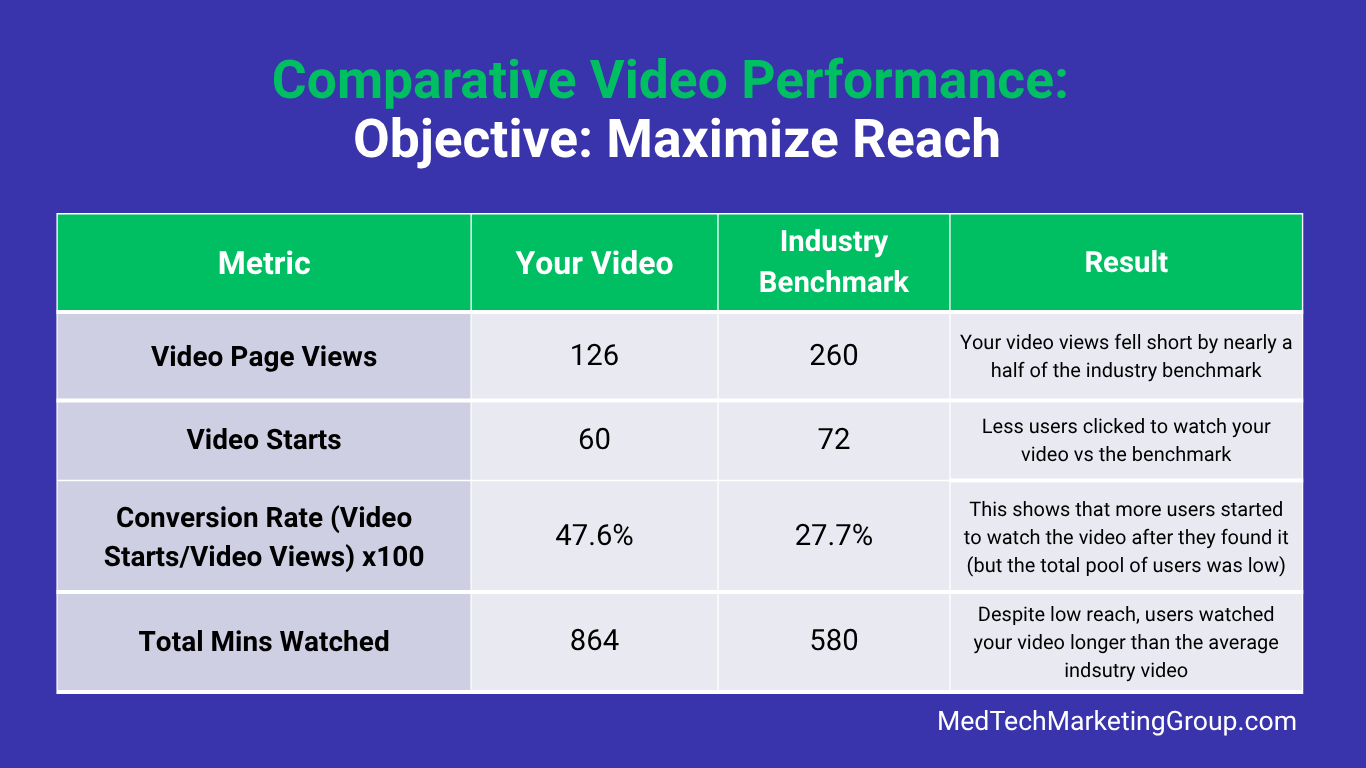
Scenario 2: Optimizing for Maximum Reach
In this example, the main objective is to maximize reach, i.e. to get as many users as possible to see the video page (to watch the video). Therefore, the main metric is Video page views and Video Starts.
📊 Click to expand text-accessible data table
| Video Page Views | Video Starts | Total Mins Watched | Completion Rate % | |:-------------------------------:|:------------:|:-------------------:|:-----------------:| | 126 | 60 | 864 | 20% | | 260 | 72 | 580 | 30 |
How did the video perform based on the reach?
Your video significantly underperformed due to lack of promotion (or inability to promote the video to the right audience).
Reach Performance Breakdown:
Video Page Views: The video didn’t reach a large enough audience, signaling that you need to improve top-of-funnel visibility. Video page views metric directly reflects the success of your promotional efforts, including both organic and paid channels. Essentially, the less you promote the link to the page where the video is hosted (top-of-funnel), the lower the visibility, i.e. fewer visitors, which ultimately results in lower view counts.
Video Starts: Less users clicked to watch your video compared to the benchmark, however, conversion rate metric plays an important role here. Why? Despite low reach, more users clicked to watch your video compared to the industry.
Total Mins Watched: However, high engagement indicates that those users who did find your video, watched video for a longer time compared to a similar video from the industry. So the problem is not the content, but reaching enough qualified audience.
Result: Your video significantly missed its reach targets. To drive video views, focus on improving your top-of-funnel visibility. Because conversion rate is so high, you can increase unique video views count by helping more audience to discover the video.
Same Data, Different Results:
As these two scenarios demonstrate, the exact same dataset can lead to two completely opposite strategic conclusions. Looking at numbers alone is never enough. True data interpretation requires a deeper understanding of your core business goals, as a metric that signals a win for one objective might reveal a problem for another.
The Final Takeaway:
When analyzing video performance, never look at numbers in isolation. A single metric can't tell the whole story. To uncover the story behind your data, you must look at the full picture and evaluate your metrics through the lens of your primary objective.
Do you need help analyzing your marketing data? Contact us.